Difference between revisions of "AnyWave:H2"
(→Computation parameters) |
|||
| Line 27: | Line 27: | ||
You can enable the different predefined bands and even change the frequency boundaries.<br/> | You can enable the different predefined bands and even change the frequency boundaries.<br/> | ||
| − | = | + | ==Review resulting graphs== |
| − | + | When the computation is finished, the resusts are saved to a MATLAB file located in the data file's folder.<br/> | |
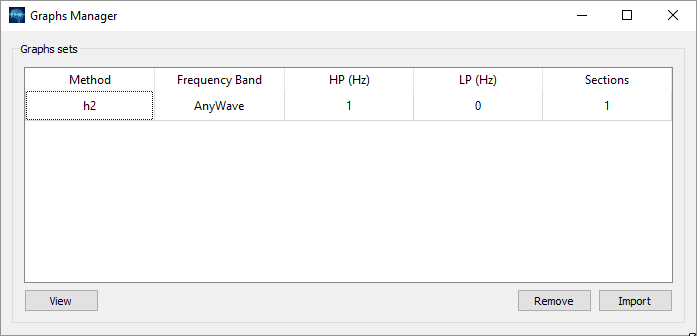
| − | + | Another plugin is automatically launched allowing you to browse the different connectivy graphs:<br/> | |
| − | + | [[File:h2graphs_ui.png]]<br /> | |
| − | + | ||
| − | + | ||
| − | + | ||
| − | + | ||
| − | + | ||
| − | + | ||
| − | + | ||
| − | + | ||
| − | + | ||
| − | + | ||
| − | + | ||
| − | + | ||
| − | + | ||
| − | + | ||
| − | + | ||
| − | + | ||
| − | + | ||
| − | + | ||
| − | + | ||
| − | + | ||
| − | + | ||
| − | + | ||
| − | + | ||
| − | + | ||
| − | + | ||
| − | + | ||
| − | + | ||
| − | + | ||
| − | + | ||
| − | + | ||
| − | + | ||
| − | + | ||
| − | + | ||
| − | + | ||
| − | + | ||
| − | + | ||
| − | + | ||
| − | [[File: | + | |
| − | + | ||
| − | + | ||
| − | + | ||
Revision as of 11:23, 13 June 2019
Contents
Purpose and usage
The plugin computes the connectivity between channels using h2/r2 algorithms.
Select the channels
The first step is to select the channels of interest.
If there is no selection when launching the plugin, a warning message will pop saying that all channels will be used for the computation.
Select sections of data
Insert markers on the data of interest using the Marking tool of AnyWave or used previous marked data.
To launch the plugin on a specific markers selection, use the markers list on the left side of the signal view:
- select the markers of interest in the lis.
- right click and choose Launc Process
- Pick the H2 process and launch.
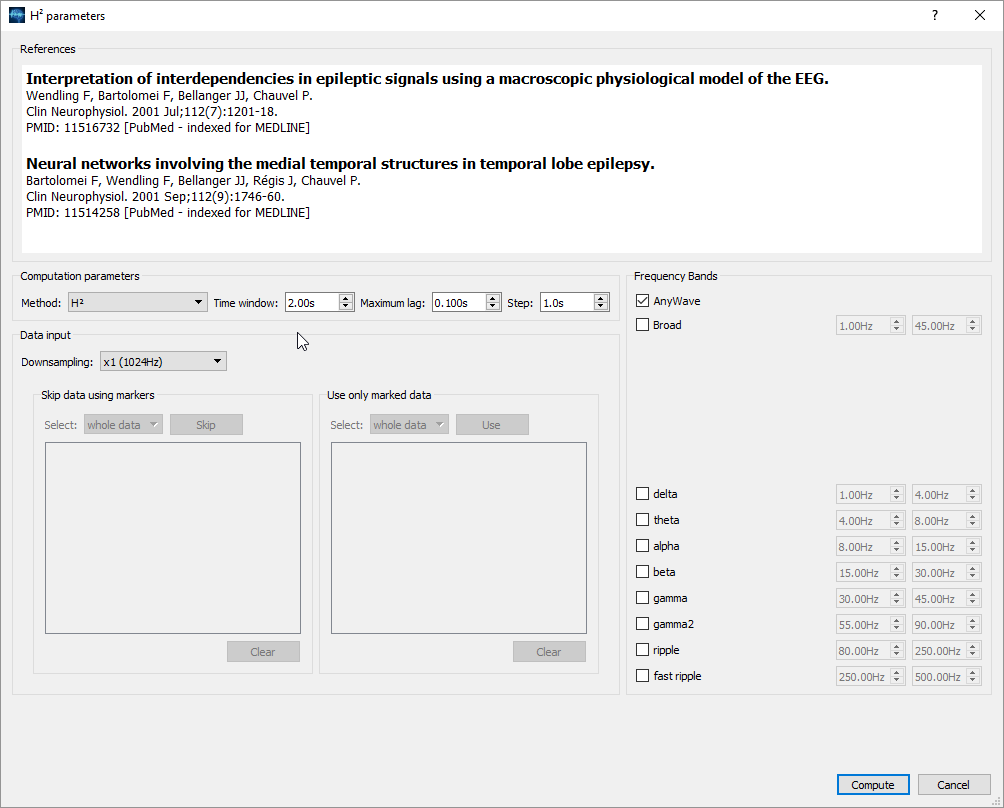
Computation parameters
Data input
To speed up the computation you may want to downsampling the data. The default is to NOT downsample the data (x1).
If you have marked data, you can specify which artefacted parts of the data to avoid in computation using the skip data using markers options:
- select the marker corresponding to the part to skip (ie 'artefact').
- click Skip button to add it to the list of markers to skip.
In the same way, you can also specify on which particular marked data compute the connectivity:
- select the marker corresponding to a period of interest.
- click the Use button to add it to the list of markers to use for computation.
Frequency bands
You can compute the connectivity on different frequency bands.
By default, the AnyWave band is selected which means the filter options set in AnyWave will be used.
You can enable the different predefined bands and even change the frequency boundaries.
Review resulting graphs
When the computation is finished, the resusts are saved to a MATLAB file located in the data file's folder.
Another plugin is automatically launched allowing you to browse the different connectivy graphs:

