Difference between revisions of "AnyWave:H2"
(→Viewing results) |
|||
| Line 54: | Line 54: | ||
Once the process has finished, a correlation graph is displayed. | Once the process has finished, a correlation graph is displayed. | ||
[[File:H2_7.png|center]] | [[File:H2_7.png|center]] | ||
| + | |||
| + | All the items within the graph can be moved with the mouse by dragging them. | ||
| + | The user can then order the graph the way he wants. | ||
| + | |||
| + | By default, all the correlations are shown in the graph but a threshold value can be set so that low correlations won't be displayed (1). | ||
| + | |||
| + | The lags or delays between two channels are represented with a pink arrow and the corresponding value in ms. | ||
| + | The values can be hidden or shown by clicking on the check box named Values. | ||
| + | |||
| + | There is also the possibility to see a mean graph of the H2 values for all the time windows. | ||
| + | Click on (2) to display the mean graph. | ||
| + | |||
| + | For illustration purpose, the button Capture (3) will allow to save the graph as a png file. | ||
| + | It is also posssible to export the graph in SVG format. | ||
| + | |||
| + | The H2 and lag values can also be exported to MATLAB format for further processing in MATLAB. | ||
| + | The .mat will contain a N x N x 2 matrix. | ||
| + | N is the number of selected channels for the computation. | ||
| + | The first dimension contains the H2 values, the second one contains the lag values. | ||
| + | |||
| + | |||
| + | The left part of the main interface displays the corresponding signals, in order to have a quick remind of data used in the current displayed time window. | ||
| + | |||
| + | |||
| + | To browse through time windows, use the buttons in the bottom part of the user interface. | ||
| + | Previous and Next will allow to see the next or previous time window. | ||
| + | |||
| + | By pressing the blue arrow button, the graph will show all the time windows using a pause delay between them. | ||
| + | The delay can be modified and the Loop option can be set to get a cycling animation toward all the time windows. | ||
Revision as of 15:56, 2 September 2014
Contents
How to use the plug-in
This plug-in can be applied to any type of channels. You must at least select a pair of channels. For each selected channels, the pairs of every possible combination will be created.
Therefore, if you select many channels the computation will take longer time to execute.
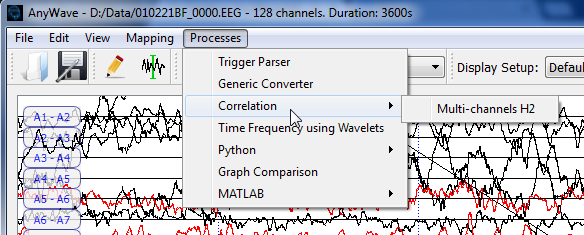
After selecting some channels, just use the processes menu and launch the process.
However, if no time selections is made, AnyWave will consider that the user wants to apply the H2 algorithm on the current displayed signals.
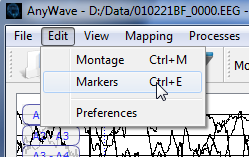
It is possible to choose part of signals to compute H2 on. To do so, refer to the user guide to see how to add markers of type selection on the data part you are consider interesting.
Use the H2 process on time selections
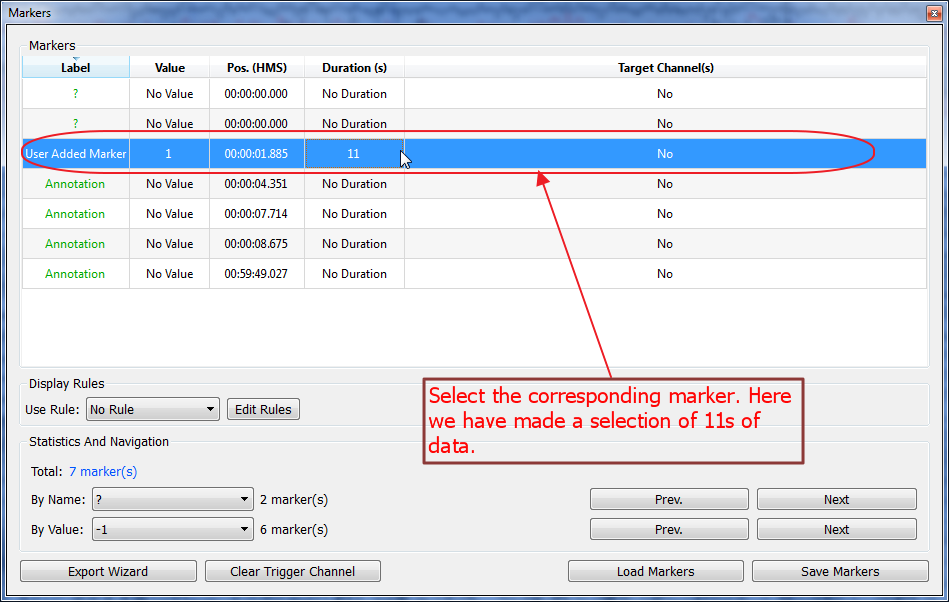
Once selections have been made, DO NOT LAUNCH the H2 process using the Processe menu but sse the markers user interface instead. See below:
Select the marker(s) you want to apply H2 on. You can use several data selections. The plug-in will then compute H2 correlations for each of the selections and will display a graph for each of the selections too.
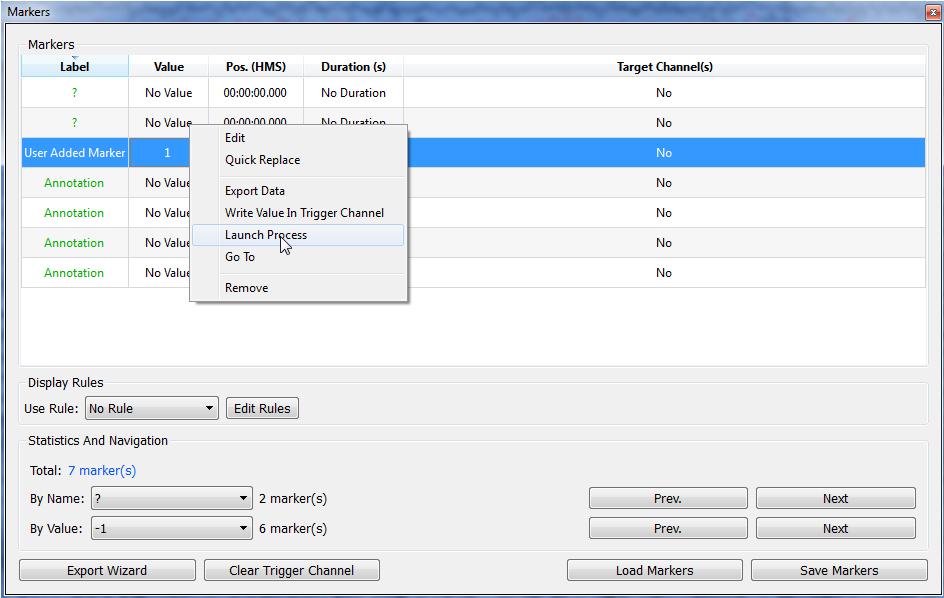
Click with the right mouse button to show the contextual menu, and choose Launch Process.
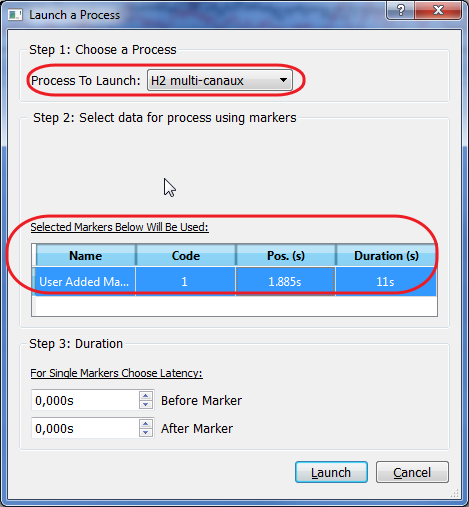
A window will appear allowing to select the process to apply on selections:
As several plug-ins may accept time selections as input, check that the H2 Multi-channels is selected as the process to apply. The window will also remind you about the time selections chosen, so you can check if everything is correct before launching the process.
The Step 3 will not apply in our case, so let the values to zero.
You are now ready to launch the process.
Setting parameters
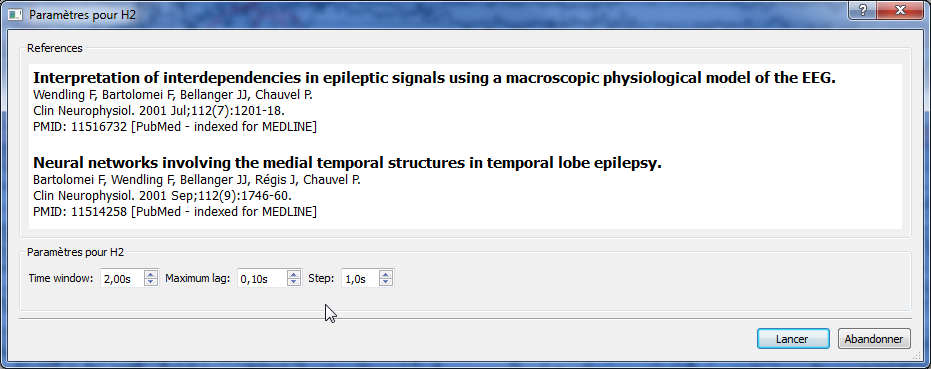
The H2 algorithm was originally implemented by F. Wendling and used with his agreement in AnyWave. The parameters interface will show references to the related publications.
The H2 is using a time window that will move across the total time selection. The H2 values are computed for each time windows.
Once the computation is done a graph will appear showing the correlations and delays between channels.
Once the process has been launched, the parameters window will appear. By default, H2 uses a 2s time window, with a maximum lag set to 100ms and a step of 1s. Change the parameters as you need then launch the processing.
Viewing results
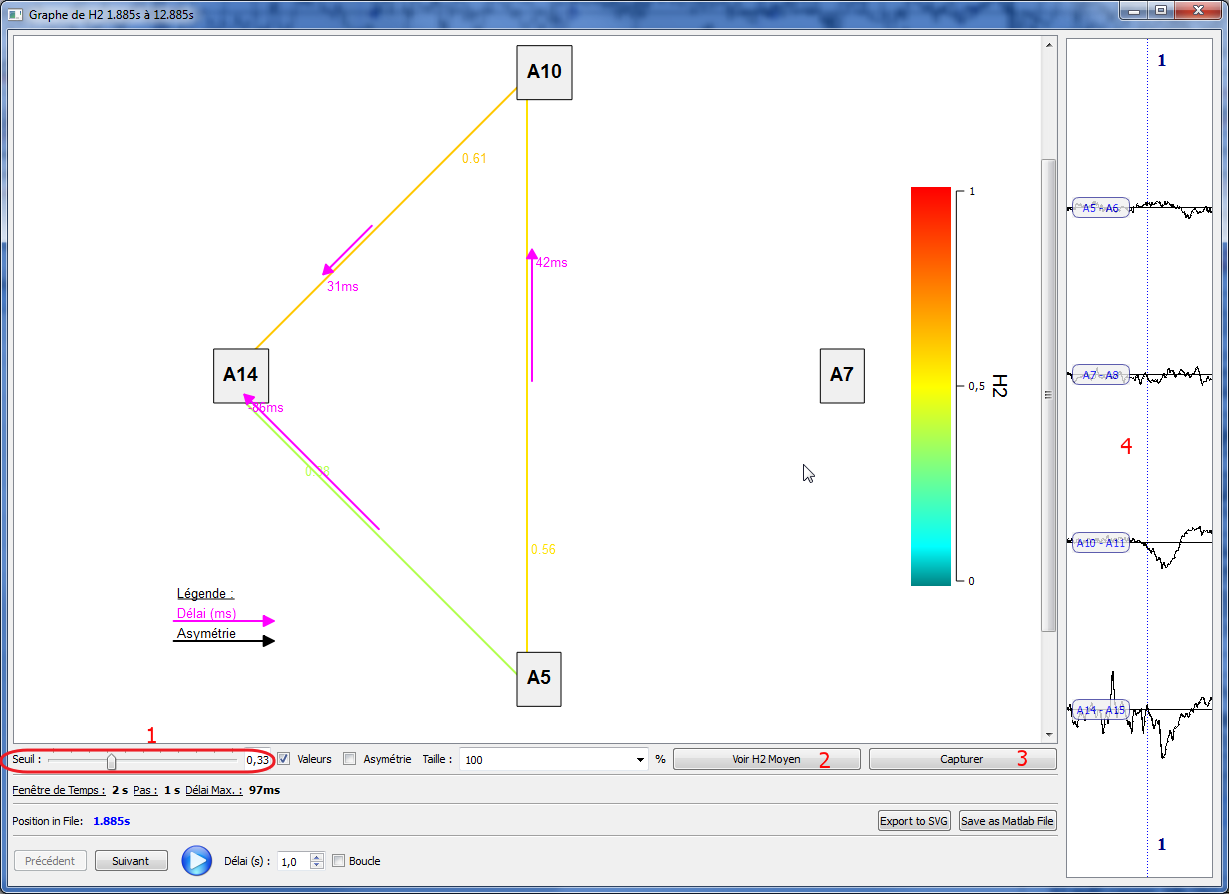
Once the process has finished, a correlation graph is displayed.
All the items within the graph can be moved with the mouse by dragging them. The user can then order the graph the way he wants.
By default, all the correlations are shown in the graph but a threshold value can be set so that low correlations won't be displayed (1).
The lags or delays between two channels are represented with a pink arrow and the corresponding value in ms. The values can be hidden or shown by clicking on the check box named Values.
There is also the possibility to see a mean graph of the H2 values for all the time windows. Click on (2) to display the mean graph.
For illustration purpose, the button Capture (3) will allow to save the graph as a png file. It is also posssible to export the graph in SVG format.
The H2 and lag values can also be exported to MATLAB format for further processing in MATLAB. The .mat will contain a N x N x 2 matrix. N is the number of selected channels for the computation. The first dimension contains the H2 values, the second one contains the lag values.
The left part of the main interface displays the corresponding signals, in order to have a quick remind of data used in the current displayed time window.
To browse through time windows, use the buttons in the bottom part of the user interface.
Previous and Next will allow to see the next or previous time window.
By pressing the blue arrow button, the graph will show all the time windows using a pause delay between them. The delay can be modified and the Loop option can be set to get a cycling animation toward all the time windows.
