Difference between revisions of "AnyWave:ERPAnalysis"
(change sam) |
|||
| (3 intermediate revisions by one user not shown) | |||
| Line 2: | Line 2: | ||
Contact: '''''[[victor.lopez-madrona@amu-univ.fr]]''''' <br /> | Contact: '''''[[victor.lopez-madrona@amu-univ.fr]]''''' <br /> | ||
| − | = | + | =MATLAB Plugin= |
This plugin is written in MATLAB and compiled to be used as a standalone program.<br /> | This plugin is written in MATLAB and compiled to be used as a standalone program.<br /> | ||
You must have the MATLAB Runtime installed on your computer in order to run this plugin.<br /> | You must have the MATLAB Runtime installed on your computer in order to run this plugin.<br /> | ||
| − | See the tutorial section about MATLAB plugins to see how to install the required packages. | + | <br /> |
| + | <big>[[AnyWave:Plugins_MCR|See the tutorial section about MATLAB plugins to see how to install the required packages.]]</big> | ||
== '''ERP Analysis''' == | == '''ERP Analysis''' == | ||
| Line 14: | Line 15: | ||
* <big>Select specific channels: it plots all the selected channels, whether they are significant or not. The stats are computed using a t-test with pval=0.05 uncorreected. The objective of this options is to have a first idea of the type of responses in your data and where you should expect significant changes.<br /></big> | * <big>Select specific channels: it plots all the selected channels, whether they are significant or not. The stats are computed using a t-test with pval=0.05 uncorreected. The objective of this options is to have a first idea of the type of responses in your data and where you should expect significant changes.<br /></big> | ||
* <big>Find significant channels: after selecting the channels of interest (it can be all the channels), it will identify those with a significant response using a t-test corrected with local False Discovery Rate. Only significant channels will be displayed.<br /></big> | * <big>Find significant channels: after selecting the channels of interest (it can be all the channels), it will identify those with a significant response using a t-test corrected with local False Discovery Rate. Only significant channels will be displayed.<br /></big> | ||
| + | [[File:figure_ERP_globale.png|framed|left]] | ||
Latest revision as of 10:58, 26 January 2024
Developed by Víctor López-Madrona
Contact: victor.lopez-madrona@amu-univ.fr
MATLAB Plugin
This plugin is written in MATLAB and compiled to be used as a standalone program.
You must have the MATLAB Runtime installed on your computer in order to run this plugin.
See the tutorial section about MATLAB plugins to see how to install the required packages.
ERP Analysis
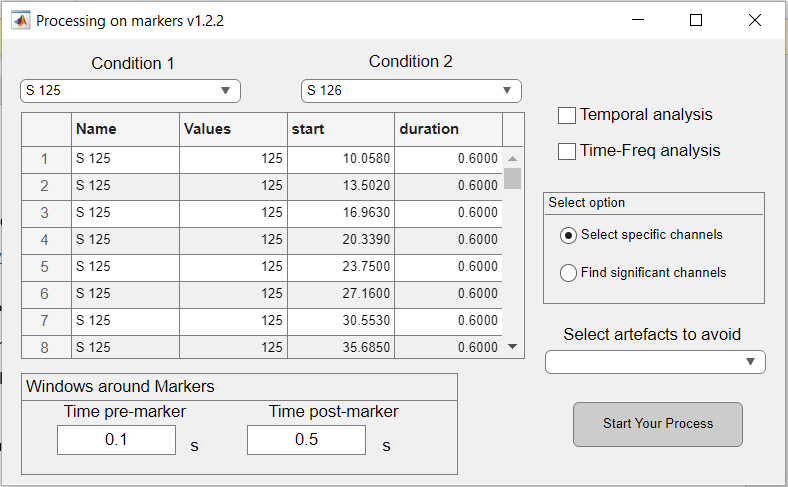
This plugin allows the analysis of event related potentials in electrophysiological recordings.
It can be used in a single condition (responses to one type of event or trigger), or as the comparison between two triggers.
In the first case, the plugin detects whether the amplitude of the response is significantly different from zero, and in the second, the stats are computed on the difference between both responses (trigger 1 - trigger 2).
Options:
- Select specific channels: it plots all the selected channels, whether they are significant or not. The stats are computed using a t-test with pval=0.05 uncorreected. The objective of this options is to have a first idea of the type of responses in your data and where you should expect significant changes.
- Find significant channels: after selecting the channels of interest (it can be all the channels), it will identify those with a significant response using a t-test corrected with local False Discovery Rate. Only significant channels will be displayed.
